 Victor Arias
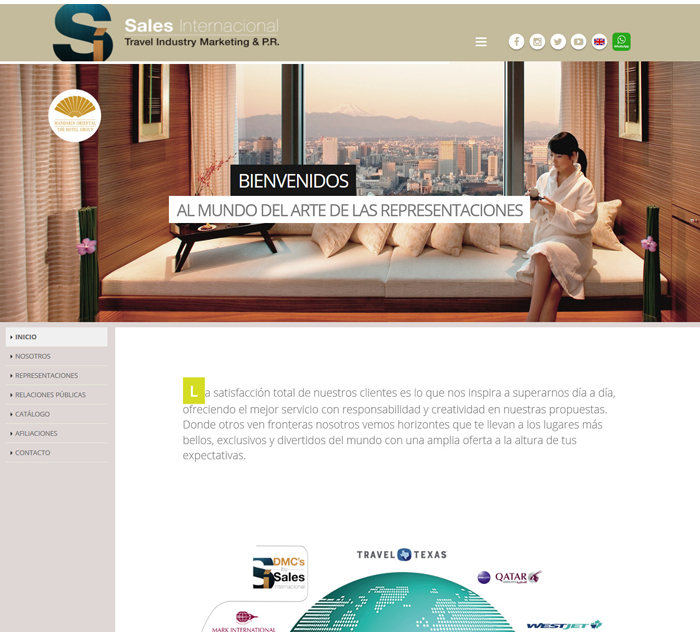
Sales Internacional is an international brand representation company for which we built the catalog and the sales dashboard from scratch: data from the ERP, from each brand and each channel — and whatever arrives in spreadsheets and CSVs — is consolidated into 6 active dashboards by brand, region and channel. After the project gross margin rose 12%.
| Client | S International · Sales Internacional |
| Industry | International brand representation |
| Service | Business Intelligence |
| Stack | Custom development, Dashboards by brand, region and channel, ERP integration, Spreadsheet and CSV consolidation, Automated data refresh, Representation catalog |
| Duration | More than 3 months |
| Our role | Custom development of the sales dashboard and the representation catalog: ERP integration, consolidation of each brand's and channel's spreadsheets and CSVs, dashboards by brand, region and channel and automated data refresh. |
| Published | January 8, 2025 |
When a company represents several international brands, the data spreads out on its own: each brand has its own way of reporting, each channel keeps its own record and the ERP holds the invoicing. Pulling all of that together to know what is worth pushing is days of work that almost never gets done.
Sales Internacional is an international brand representation company for which we built the catalog and the sales dashboard from scratch: data from the ERP, from each brand and each channel — and whatever arrives in spreadsheets and CSVs — is consolidated into 6 active dashboards by brand, region and channel. After the project gross margin rose 12%.
The challenge: data was scattered and decisions were made late
Representing international brands means working with many sources at once: invoicing from the management system, the reports each brand sends, sales by channel and the spreadsheets used to tie up loose ends. The problem is not having data, it is that the data does not talk to itself.
One figure per brand, another per channel
Each representation brings its own format and its own criteria: different periods, different names for the same product, currencies that need converting. Without prior consolidation, comparing one brand with another means comparing two things that are not measured the same way.
The report arrived when it was no longer useful
The report was assembled by hand and closed at month end, so commercial decisions were made with data from weeks earlier. In a representation business, where the relationship with the brand is negotiated daily, arriving late means arriving without arguments.
Selling a lot is not earning more
Invoicing alone does not say whether a representation pays off: margin does. And margin only appears when sales data is crossed with cost data, which usually lives in different systems.
The solution: catalog and dashboards built from scratch
The work was custom because the problem was not drawing charts, it was ordering the sources. Once the data from the ERP, from each brand, from each channel and from the manual files is consolidated under a single criterion, the dashboard is the easy part.
 Before drawing a chart you have to decide what is measured: in a representation business, margin weighs more than volume.
Connecting the ERP and consolidating the rest
Invoicing comes from the management system, and everything else — each brand's reports, sales by channel and files arriving as spreadsheets or CSVs — is integrated into the same data model. Consolidation stops being month-end manual work and becomes part of the system.
Dashboards by brand, region and channel
Each view answers a specific question: how a brand is doing, how a region behaves or which channel is performing best. Because they all share the same data source, the figures in one dashboard match those in another, which is what makes it possible to decide based on them.
From data to catalog: a single source
The representation catalog and the reports drink from the same source, so what is published and what is measured do not contradict each other. On a site presenting international brands, that consistency is part of the service being sold.
How we did it in more than three months
The project was ordered from the inside out: first the sources and their common criteria, then the dashboards and finally the catalog. Starting with the chart would have meant starting with the part that causes the fewest problems.
 The business behind the data is tourism and international brands: the dashboard is there to decide where to put the effort.
Ordering the sources before drawing
It was defined what each thing is called, which period it is compared against and how whatever arrives in other currencies or formats is converted. That is the step nobody sees and the one that decides whether the dashboard's numbers can be used to make decisions.
Validating the numbers with the people who use them
The first dashboards were checked against the people who used to assemble the reports by hand, comparing figure by figure until they matched. In a data project, trust in the number is the main deliverable: if someone spots a mismatch, they stop looking at the dashboard.
Results
The project was delivered with the data consolidated, the dashboards by brand, region and channel running and the catalog fed by the same source. These were the needs and how they were solved:
| Need | How it was solved |
| Data scattered across brands, channels and spreadsheets | ERP integration and consolidation of spreadsheets and CSVs |
| Knowing how each represented brand is doing | A dashboard per brand |
| Comparing regions and sales channels | Dashboards by region and by channel |
| Waiting for the month-end report | Automated data refresh |
| Seeing volume but not profitability | Gross margin as the main metric |
| Keeping catalog and reports consistent | A single data source for both |
The measured results of the project: gross margin rose 12% and there are 6 active dashboards. The two figures are connected: when margin is visible by brand and by channel, it is possible to decide where to push and where not to, and that decision is what moves profitability.
What an international sales dashboard needs
If you represent brands or sell across several channels and are still consolidating information by hand, these are the points that decide whether a dashboard is useful:
- A single criterion for all sources, because without it every brand is measured differently and the comparison is worthless.
- A connection to the management system, which is where real invoicing lives and not a copy of it.
- Integration of whatever arrives in spreadsheets, which in practice is still part of the data.
- Views by brand, region and channel, because each decision needs a different cut.
- Margin, not just volume, since invoicing more does not always mean earning more.
- Automated refresh, so the report is available when the decision is made and not weeks later.
If your data is scattered and you want to turn it into decisions, our business intelligence page explains how we work, and you can write to us to go through it together.
Frequently asked questions
Why a custom dashboard instead of a standard BI tool?
Because the sources are heterogeneous: an ERP, data from each represented brand, data from each channel and files arriving as spreadsheets and CSVs. The tool was not the problem; the work was in consolidating all of that into one reliable source. Once that is solved, the chart is the easy part.
What does a representation company gain from a dashboard?
Seeing margin by brand and channel instead of volume alone. Representing a brand that invoices a lot but leaves little margin is not the same business as representing a smaller, more profitable one, and that difference only shows when the data sits together under the same criteria.
How often is the dashboard data refreshed?
Automatically from the ERP and from the periodic uploads, instead of the manual process used before. The difference is not just the time saved: the report stops being a month-end snapshot and becomes available when the decision is actually made.
How long does a custom sales dashboard take?
This project took more than three months. The schedule is set by ERP integration, consolidation of spreadsheets and CSVs, dashboards by brand, region and channel, automated data refresh and the representation catalog.